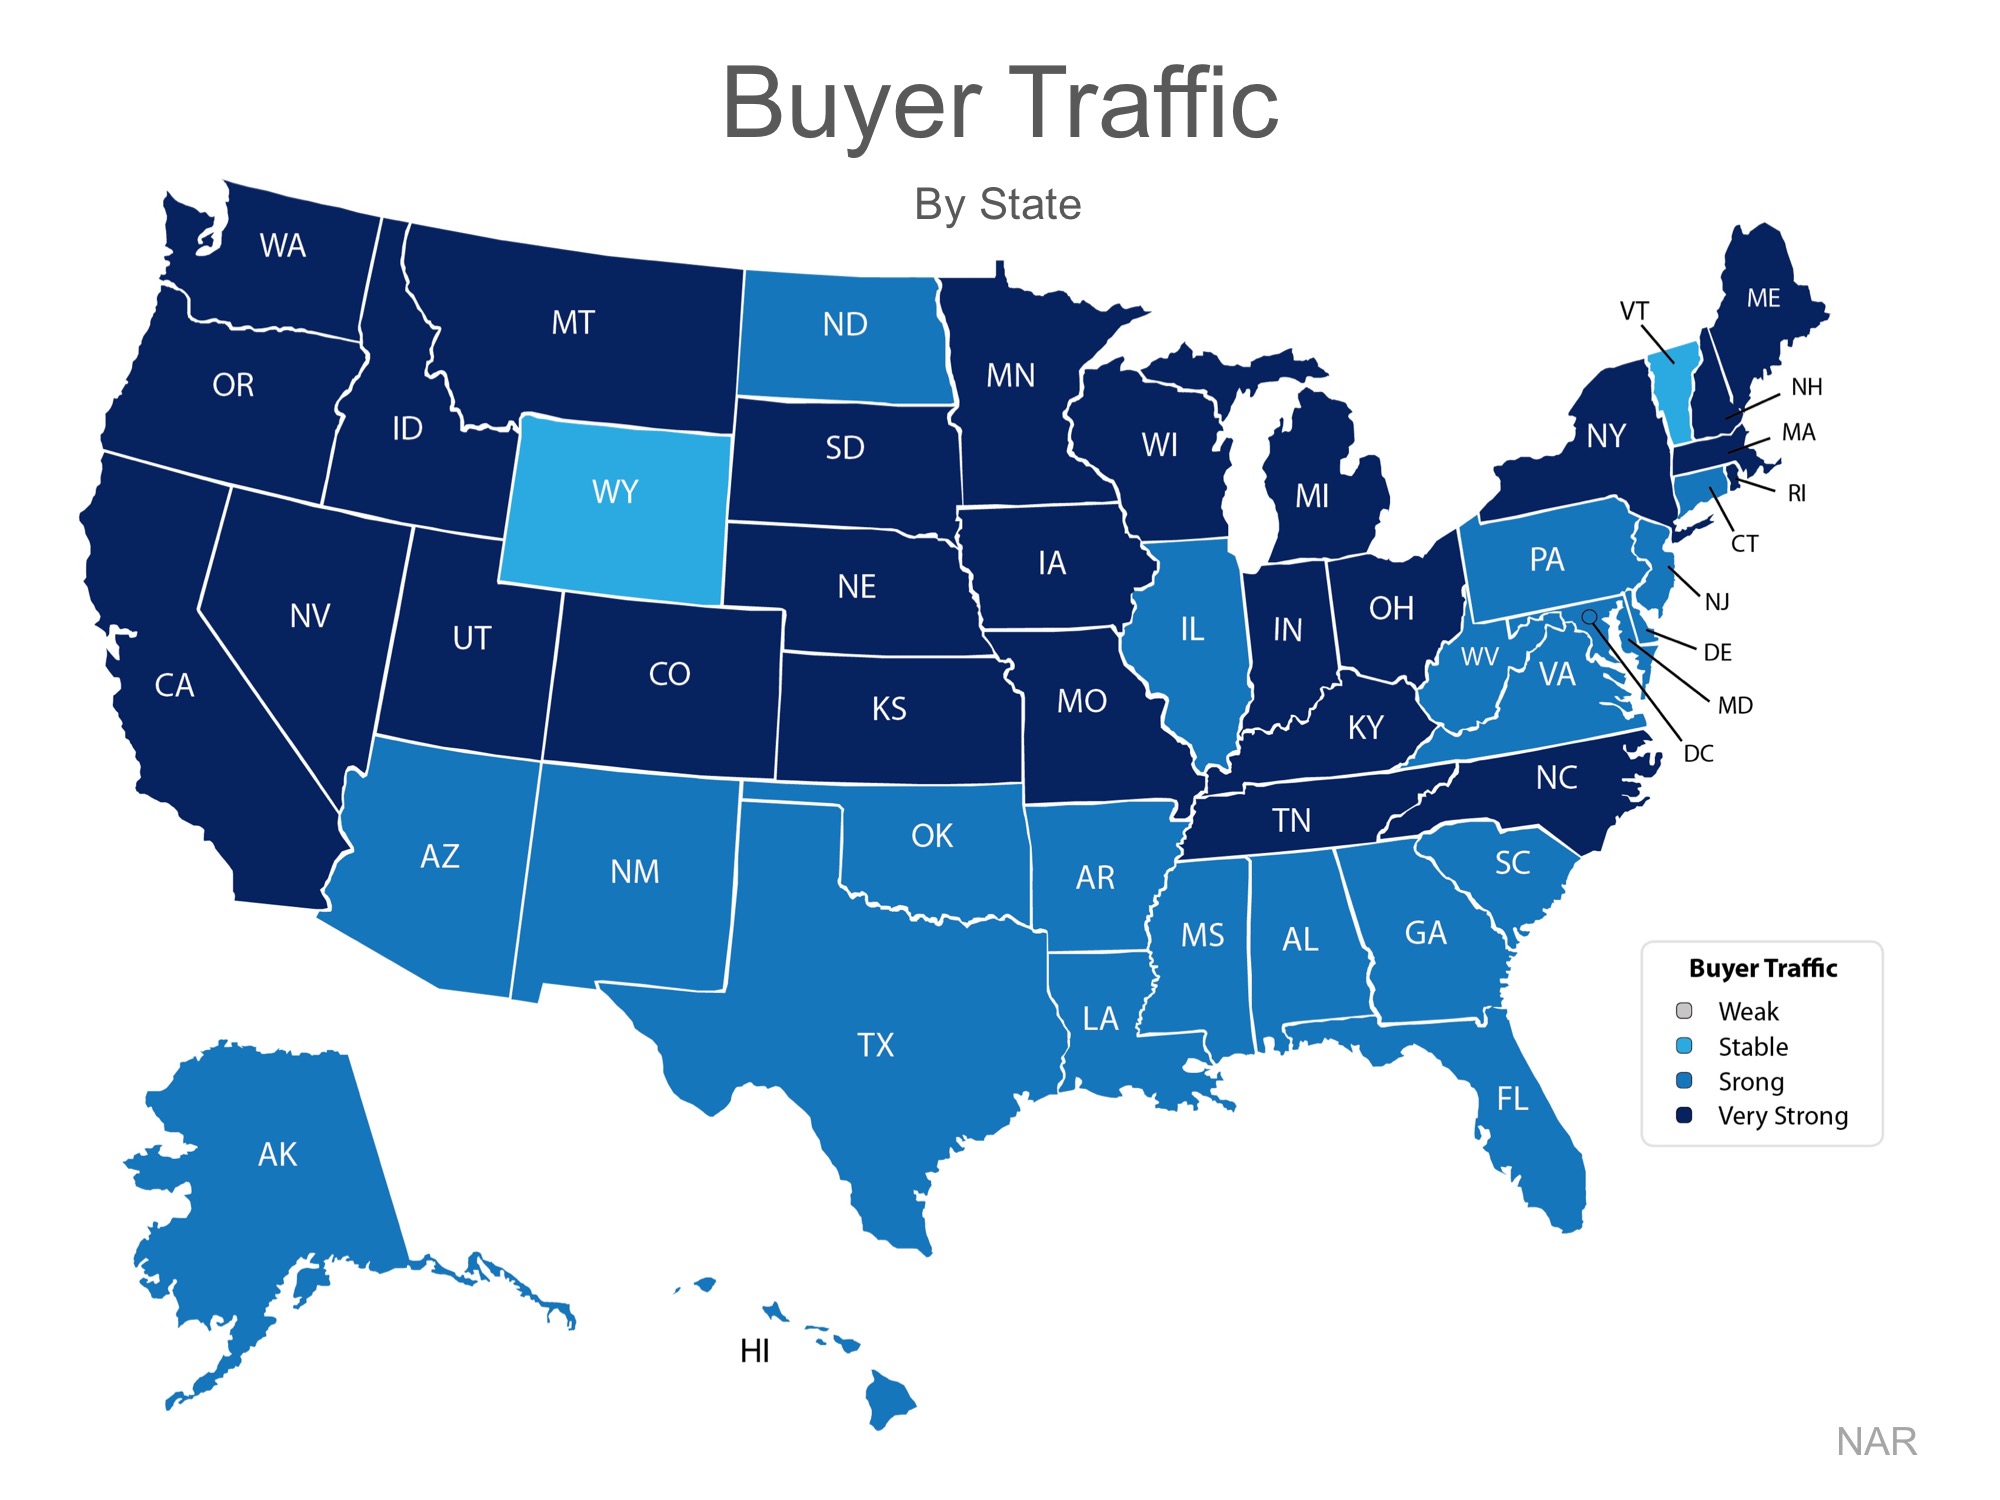
The National Association of REALTORS® surveyed their members for their monthly Confidence Index.
The REALTORS® Confidence Index is a key indicator of housing market strength based on a monthly survey sent to over 50,000 real estate practitioners. Practitioners are asked about their expectations for home sales, prices and market conditions.
Homes sold in less than a month in 24 out of 50 states, and Washington D.C.
Homes typically went under contract in 27 days in May!
The Joint Centerof Housing Studies (JCHS) at Harvard University recently released their 2017 State of the Nation’s Housing Study, and a recent blog from JCHS revealed some of the more surprising aspects of the study.
The first two revelations centered around the shortage of housing inventory currently available in both existing homes and new construction. Continue reading... click the link below
Interest rates have hovered around 4% for the majority of 2017, which has given many buyers relief from rising home prices and has helped with affordability. Experts predict that rates will increase by the end of 2017 and will be about three-quarters of a percentage point higher, at 4.5%, by the end of 2018.
Last week’s Freddie Mac Primary Mortgage Market Surveyrevealed that interest rates for a 30-year fixed rate mortgage have fallen to their lowest mark this year, at 3.88%. This is great news for homebuyers looking to purchase and homeowners looking to refinance.
Continue reading click the link below...
Forbes.com recently released the latest results of their American Dream Index, in which they measure “the prosperity of the middle class, and…examine which states best support the American Dream.” When To Buy A House
The monthly index measures several different economic factors, including goods-producing employment, personal and commercial bankruptcies, building permits, startup activity, unemployment insurance claims, labor force participation, and layoffs.
The national index score was rounded out to 100.0 in January as a baseline for comparison and it rose the fourth straight month in a row to 101.8.
Alaska, coming in at 89.4, represented the lowest score on the index due in part to the recent collapse in oil prices. In contrast, Wyoming came in with the highest score at 115.1. The full results can be seen in the map below.
We all realize that the best time to sell anything is when demand is high and the supply of that item is limited. Two major reports issued by the National Association of Realtors (NAR) revealed information that suggests that now continues to be a great time to sell your house. Let’s look at the data covered in the latest REALTORS® Confidence Index and Existing Home Sales Report.
REALTORS® CONFIDENCE INDEX
Every month, NAR surveys “over 50,000 real estate practitioners about their expectations for home sales, prices and market conditions.” This month, the index showed (again) that home-buying demand continued to outpace supply in May. The map below illustrates buyer demand broken down by state (the darker your state, the stronger the demand is there). Buyhome in Plainfield In addition to revealing high demand, the index also mentioned that “compared to conditions in the same month last year, seller traffic conditions were ‘weak’ in 24 states, ‘stable’ in 25 states, and ‘strong’ in D.C and West Virginia.”Takeaway: Demand for housing continues to be strong throughout 2017, but supply is struggling to keep up, and this trend is likely to continue into 2018. Buyhome downers grove
The National Association of Realtors (NAR) recently released the findings of their Q2 Homeownership Opportunities and Market Experience (HOME) Survey. The report covers core topics like, “if now is a good time to buy or sell a home, the perception of home price changes, perceived ability to qualify for a mortgage, and [an] outlook on the U.S. economy.”
The survey revealed that 75% of homeowners think now is a good time to sell, compared to 70% last quarter. This is a considerable increase from more than a year ago when 66% agreed.


 We all realize that the best time to sell anything is when demand is high and the supply of that item is limited. Two major reports issued by the National Association of Realtors (NAR) revealed information that suggests that now continues to be a great time to sell your house. Let’s look at the data covered in the latest